library(shiny)

# UI -----
ui <- fluidPage(
  h1("Hello, World!"),
  # Add input
  textInput(inputId = 'yname',
            label = 'Your Name',
            value = '',
            placeholder = NULL),
  # Add output
  textOutput('greeting')
)

# Server -----
server <- function(input, output, session) {
  # Define the output
  output$greeting <- renderText({
    paste('Hello, ', input$yname, "!", sep = '')
  })
}

# Run the app -----
shinyApp(ui = ui, server = server)Introduction to Shiny
Welcome!

Dr. Mark Hanly
Senior Lecturer, Statistician
Centre for Big Data Research in Health (CBDRH)
UNSW Medicine & Health
Ms. Rory Chen
Manager of Dementias Platform Australia (DPAU)
Centre for Healthy Brain Ageing (CHeBA)
Discipline of Psychiatry & Mental Health
School of Clinical Medicine, UNSW Medicine & Health

Pre-requisites
Comfortable with simple operations in R and R Studio
No prior knowledge of Shiny apps required.
Install the {shiny} package if you haven’t already
Today’s topic
The workshop will run for 1 hour.
What is R Shiny - basic
Real-world R Shiny App Demo to inspire your own
Slides + Coding Example + Exercise
Ask questions!
What is R Shiny
Shiny is a framework for creating interactive web applications using R code.
- UI (User Interface): How your app looks
- Server: How your app works
- Reactivity: User changes input controls → updates output (via server function)
Why use R Shiny
- R users can build web applications without HTML/CSS/JS knowledge
- Accessible and shareable via browser
- Great for interactive data visualization and analysis
- Useful for presentations, websites, and collaboration
- Apps as teaching aids …
Demo of R Shiny Apps
Structure of a Shiny App
UI & Server
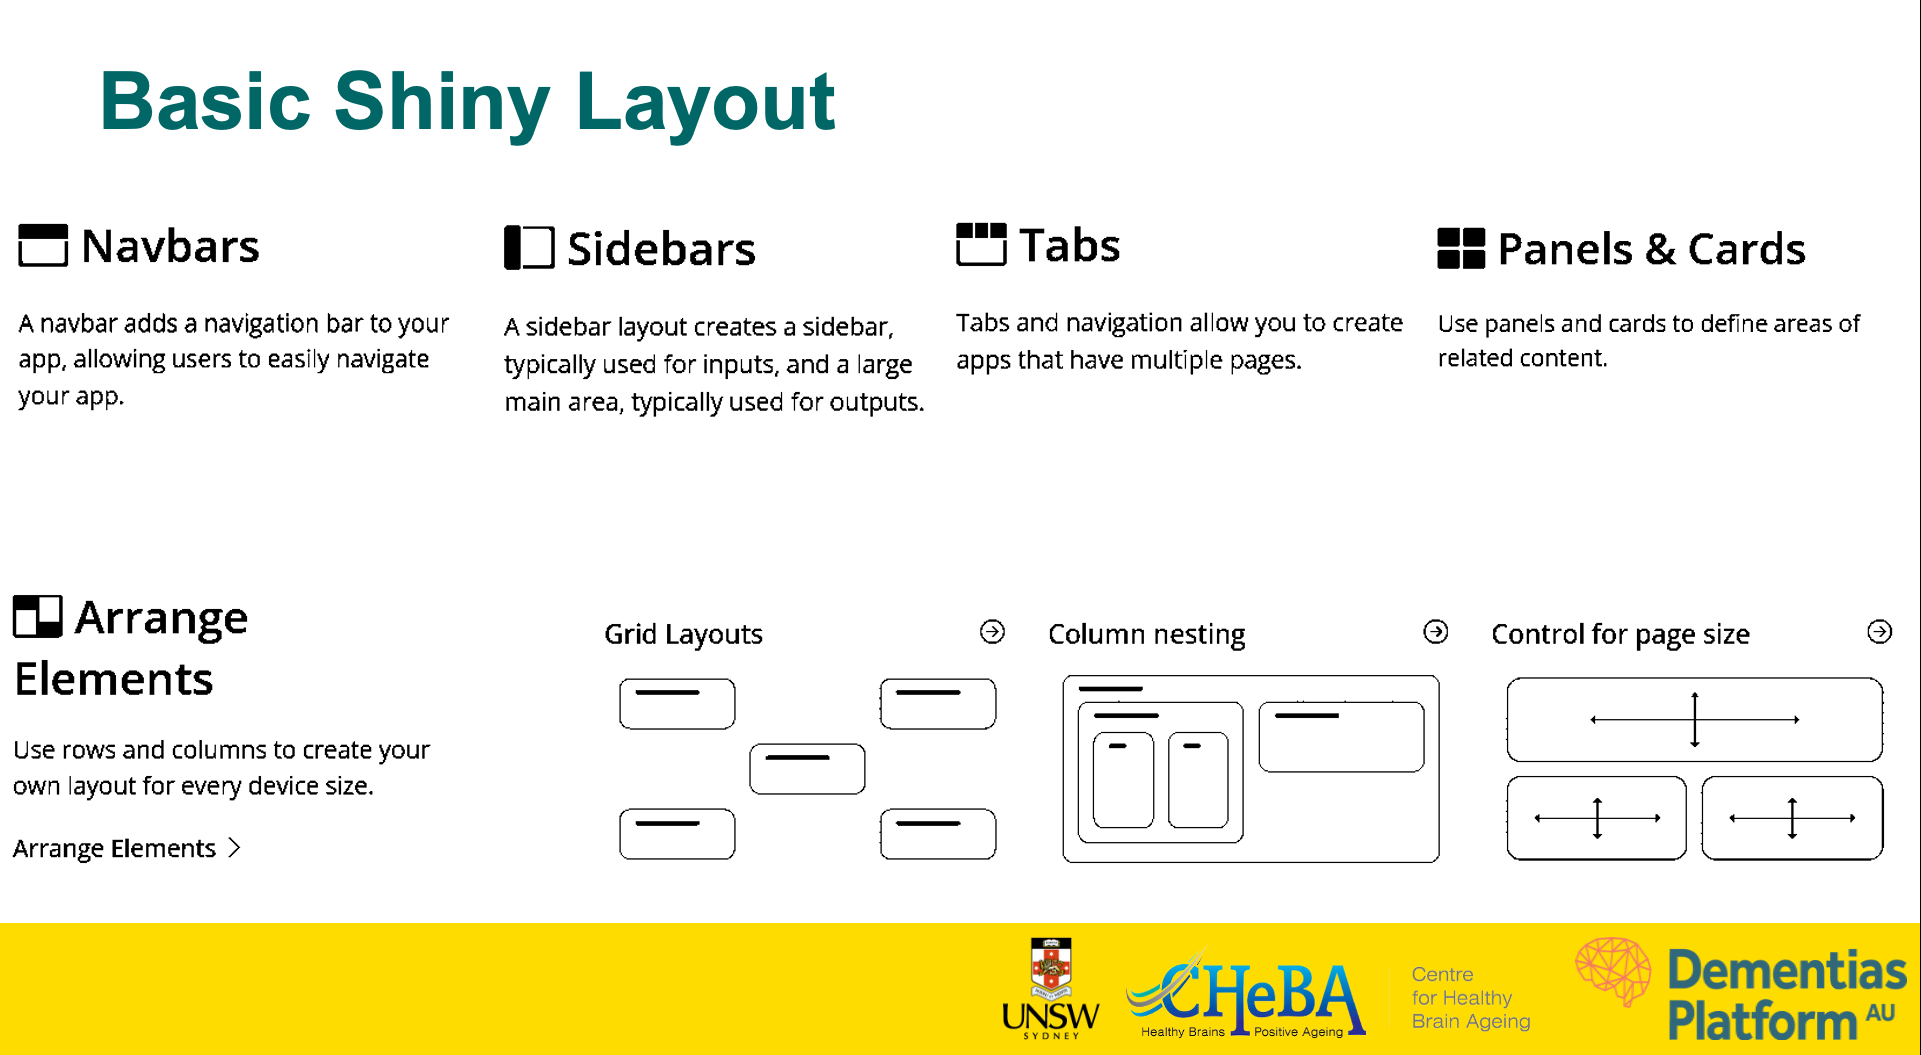
UI
Defines the layout and appearance.
Contains elements such as:
- layout structures (sidebars)
- inputs (text boxes, sliders, buttons)
- outputs (plots, tables)
Server
Performs calculations.
Contains the logic to respond to user inputs, and update outputs.
Communicates with the UI to dynamically render outputs.
Exercise 1 - Hello, World!
Open up your R Studio.
Make sure you have the {shiny} package installed.
Create an
app.Rfile.load
shinywithlibrary(shiny)Add
uiandserverelements,as well as
shinyApp(ui = ui, server = server).Click
Run- Check it works.
Exercise 2 - Hello, Name!
- Inside the fluidPage function:
- add
textInput - add
textOutput
- add
- Define the output in server function
Exercise 3 - Hello, Name! + Confirm
- Inside the fluidPage function:
- add Action Button
- add Reactive output
- Define the reactive output
library(shiny)

# UI -----
ui <- fluidPage(
  h1("Hello, World!"),
  textInput(inputId = 'yname',label = 'Your Name',value = '',placeholder = NULL),
  textOutput('greeting'),
  br(),
  fluidRow(
    # action button
    column(width = 3, actionButton(inputId = 'confirm',label = "Confirm")),
    #reactive output
    column(width = 8, verbatimTextOutput('greetingv'))
  )
)

# Server -----
server <- function(input, output, session) {
  # Define the output
  output$greetingv <- renderText({
    paste('Hello, ', input$yname, "!", sep = '')}) |>
  bindEvent(input$confirm) # this means when the action button is clicked

  output$greeting <- renderText({
    paste('Hello, ', input$yname, "!", sep = '')
  })


}

# Run the app -----
shinyApp(ui = ui, server = server)
Exercise 3 - Hello, Name! + Confirm - Demo
#| '!! shinylive warning !!': |
#|   shinylive does not work in self-contained HTML documents.
#|   Please set `embed-resources: false` in your metadata.
#| standalone: true
#| viewerHeight: 600
library(shiny)

# UI -----
ui <- fluidPage(
  h1("Hello, World!"),
  textInput(inputId = 'yname',
            label = 'Your Name',
            value = '',
            placeholder = NULL),
  textOutput('greeting'),
  br(),
  fluidRow(
    # action button
    column(width = 3, actionButton(inputId = 'confirm',label = "Confirm")),
    # reactive output
    column(width = 8, verbatimTextOutput('greetingv'))
  )
)
# Server -----
server <- function(input, output, session) {
  # Define the output
  output$greeting <- renderText({
    paste('Hello, ', input$yname, "!", sep = '')
  })

  output$greetingv <- renderText({
    paste('Hello, ', input$yname, "!", sep = '')}) |>
    bindEvent(input$confirm) # this means when the action button is clicked
}

# Run the app -----
shinyApp(ui = ui, server = server)
Shiny UI Components
Inputs
- Action Buttons
- Checkbox
- Date
- Text
- Numeric
- Slider
…
Outputs
- Text
- Tables
- Plots
- Images
…
Display Messages
- Tooltips
- Notifications
- Popovers
- Progress Bar
- Modal
…
Basic Shiny Inputs - demo
#| '!! shinylive warning !!': |
#|   shinylive does not work in self-contained HTML documents.
#|   Please set `embed-resources: false` in your metadata.
#| standalone: true
#| viewerHeight: 600
# Packages -----
library(shiny)
library(bslib)

# UI -----
ui <- page_fluid(
  titlePanel("Shiny Basic Input Widgets"),
  layout_column_wrap(
    card(
      card_header("Buttons"),
      actionButton("action", "Action"),
      submitButton("Submit")
    ),
   card(
      card_header("File input"),
      fileInput("file", label = NULL)
    ),
    card(
      card_header("Single checkbox"),
      checkboxInput("checkbox", "Choice A", value = TRUE)
    ),
    card(
      card_header("Checkbox group"),
      checkboxGroupInput(
        "checkGroup",
        "Select all that apply",
        choices = list("Choice 1" = 1, "Choice 2" = 2, "Choice 3" = 3),
        selected = 1
      )
    ),
    card(
      card_header("Date input"),
      dateInput("date", "Select date", value = "2025-01-01")
    ),
    card(
      card_header("Date range input"),
      dateRangeInput("dates", "Select dates")
    ),
    card(
      card_header("Numeric input"),
      numericInput("num", "Input number", value = 1)
    ),
    card(
      card_header("Sliders"),
      sliderInput(
        "slider1",
        "Set value",
        min = 0,
        max = 100,
        value = 50
      ),
      sliderInput(
        "slider2",
        "Set value range",
        min = 0,
        max = 100,
        value = c(25, 75)
      )
    ),
    card(
      card_header("Help text"),
      helpText(
        "Note: help text isn't a true widget,",
        "but it provides an easy way to add text to",
        "accompany other widgets."
      )
    ),

    card(
      card_header("Radio buttons"),
      radioButtons(
        "radio",
        "Select option",
        choices = list("Choice 1" = 1, "Choice 2" = 2, "Choice 3" = 3),
        selected = 1
      )
    ),
    card(
      card_header("Select box"),
      selectInput(
        "select",
        "Select option",
        choices = list("Choice 1" = 1, "Choice 2" = 2, "Choice 3" = 3),
        selected = 1
      )
    ),

    card(
      card_header("Text input"),
      textInput("text", label = NULL, value = "Enter text..."),
      textAreaInput("textarea", label = "Text Area", rows = 3, value = "Enter text...")
    )
  )
)

# Define server logic ----
server <- function(input, output) {

}

# Run the app ----
shinyApp(ui = ui, server = server)
Cool Shiny Inputs
Basic Shiny Layout
Mini App: QR Codes Generator - code
library(shiny)
library(qrcode)

ui <- fluidPage(
  sidebarLayout(
    sidebarPanel(
      textInput("link", "Enter Link here", "www.google.com"),
      downloadButton("save", "Download QR")
    ),
    mainPanel(
      plotOutput("tplot" )
    )
  )
)

server <- function(input, output) {
  tplot <- reactive({
    qr <- qr_code(input$link)
    plot(qr)

  })
  output$tplot <- renderPlot({
    tplot()
  })

  # downloadHandler contains 2 arguments as functions, namely filename, content
  output$save <- downloadHandler(
    filename =  function() {
      paste("myplot.pdf")
    },
    # content is a function with argument file. content writes the plot to the device
    content = function(file) {
      pdf(file) # open the pdf device
      plot(qr_code(input$link)) # draw the plot
      dev.off()  # turn the device off
    }
  )
}

# Run the app -----
shinyApp(ui = ui, server = server)
Mini App: QR Codes Generator - demo
#| '!! shinylive warning !!': |
#|   shinylive does not work in self-contained HTML documents.
#|   Please set `embed-resources: false` in your metadata.
#| standalone: true
#| viewerHeight: 600
library(shiny)
library(qrcode)

ui <- fluidPage(
  sidebarLayout(
    sidebarPanel(
      wellPanel(
        h3("R Shiny at UNSW"),
        fluidRow(
        "Are you using R Shiny or thinking about it?
         We’re conducting a short survey to better understand if and how UNSW researchers use R Shiny. ")),
      br(),
      textInput("link", "Enter Link here", "https://forms.office.com/Pages/ResponsePage.aspx?id=pM_2PxXn20i44Qhnufn7o--kDxHVBa1CuZzopnfzpj9UQ0JFQ1RPRUUyUFUwM09PRU5TRDNJSjlDVSQlQCN0PWcu&utm_source=Unknown+List&utm_campaign=b3d3640e12-EMAIL_CAMPAIGN_2023_01_12_04_27_COPY_01&utm_medium=email&utm_term=0_-0056c8e67b-&mc_cid=b3d3640e12&mc_eid=UNIQID"),
      downloadButton("save", "Download QR")),
    mainPanel(
      plotOutput("tplot" )
    )
  )
)

server <- function(input, output) {
  tplot <- reactive({
    qr <- qr_code(input$link)
    plot(qr)
  })
  output$tplot <- renderPlot({
    tplot()
  })

  # downloadHandler contains 2 arguments as functions, namely filename, content
  output$save <- downloadHandler(
    filename =  function() {
      paste("myplot.pdf")
    },
    # content is a function with argument file. content writes the plot to the device
    content = function(file) {
      pdf(file) # open the pdf device
      plot(qr_code(input$link)) # draw the plot
      dev.off()  # turn the device off
    }
  )
}

# Run the app -----
shinyApp(ui = ui, server = server)
Mini App: Shiny App to Explore Data - code
# Packages -----
library(shiny)
library(ggplot2)
library(GWalkR)

data(iris)

# UI -----
ui <- fluidPage(
  titlePanel("Explore data with GwalkR"),
  gwalkrOutput("mygraph")
)

# Server -----
server <- function(input, output, session) {
  output$mygraph <- renderGwalkr(
    gwalkr(iris)
  )
}

# Run the app -----
shinyApp(ui = ui, server = server)
Mini App: Map Filter - demo
#| '!! shinylive warning !!': |
#|   shinylive does not work in self-contained HTML documents.
#|   Please set `embed-resources: false` in your metadata.
#| standalone: true
#| viewerHeight: 600
# Packages -----
library(shiny)
library(leaflet)
library(spData)
library(dplyr)
library(sf)

# Prepare Data -----
data(world)
mapdata <- world |> mutate(country = name_long)

# UI -----
ui <- function(id) {
  shiny::fluidPage(
    shiny::wellPanel(shiny::actionButton("resetmap", "Reset Map")),
    leaflet::leafletOutput("mapfilter", height = 400),
    shiny::tags$h4("Selected countries:"),
    shiny::verbatimTextOutput("filtered_country")
  )
}

# Server -----
server <- function(input, output, session) {

    # Define reactive values
    rv <- shiny::reactiveValues(selected_countries = NULL, # Initialize reactive value for selected counties
                                last_click_id = NULL,
                                filtered_data = mapdata)


    shiny::observeEvent(input$mapfilter_shape_click, { # this is the logic behind the "click" of the map.

      click <- input$mapfilter_shape_click
      rv$last_click_id <- click$id
      ########## map behavior ################

      # If a country is clicked
      if (click$id %in% rv$selected_countries) {
        # If selected, remove it
        rv$selected_countries <- rv$selected_countries[rv$selected_countries != click$id]

      } else if(click$id == "selected"){ # when a county is clicked again it is removed

        rv$selected_countries <- rv$selected_countries[rv$selected_countries != tail(rv$selected_countries, n = 1)]

      }else {
        # If not selected, add it
        rv$selected_countries <- c(rv$selected_countries, click$id)
      }

      # Now update the leaflet
      leaflet::leafletProxy("mapfilter", session) |>
        leaflet::addPolygons(data = mapdata,
                             layerId = ~country,
                             label = ~country,
                             fillColor = ifelse(mapdata$country %in% rv$selected_countries, "#F47A60", "#7fe7dc"), # Change fill color based on selection
                             col = "#316879",
                             weight = 2,
                             fillOpacity = ifelse(mapdata$country %in% rv$selected_countries, 1, 0.5),
                             highlight = highlightOptions(
                               fillOpacity = 1,
                               bringToFront = TRUE)
        )

    })

    output$filtered_country <- shiny::renderPrint({
      paste(rv$selected_countries, collapse = ',')
    })

    # Leaflet
    output$mapfilter <- leaflet::renderLeaflet({ # rendering the filter map

      leaflet::leaflet() |>
        leaflet::addTiles() |> # The is the base map
        leaflet::addPolygons(data = mapdata,
                             color = '#316879',
                             weight = 1,
                             layerId = ~country,
                             label = ~country,
                             fillColor = "#7fe7dc",
                             fillOpacity = .5,
                             highlight = highlightOptions(
                               fillOpacity = 1,
                               bringToFront = TRUE
                             )) |>
        leaflet::setView(zoom = 1, lng = 0, lat =50)

    })

    # Reset the map filter
    shiny::observeEvent(input$resetmap, {

      rv$selected_countries <- NULL
      rv$last_click_id <- NULL
      rv$filtered_data <- mapdata

      leafletProxy("mapfilter", session) |>
        leaflet::addPolygons(data = mapdata,
                             color = '#316879',
                             weight = 1,
                             layerId = ~country,
                             label = ~country,
                             fillColor = "#7fe7dc",
                             fillOpacity = .5,
                             highlight = highlightOptions(
                               fillOpacity = 1,
                               bringToFront = TRUE
                             )) |>
        leaflet::setView(zoom = 1, lng = 0, lat =50)

    })


    # Return reactive values
    return(
      list(
        value = shiny::reactive(rv$selected_countries),
        filtered  = shiny::reactive(rv$filtered_data)
      )
    )

}


# Run the app -----
shinyApp(ui = ui, server = server)
Mini App: Map Filter - code
# Packages -----
library(shiny)
library(leaflet)
library(spData)
library(dplyr)
library(sf)

# Prepare Data -----
data(world)
mapdata <- world |> mutate(country = name_long)

# UI -----
ui <- function(id) {
  shiny::fluidPage(
    shiny::wellPanel(shiny::actionButton("resetmap", "Reset Map")),
    leaflet::leafletOutput("mapfilter", height = 400),
    shiny::tags$h4("Selected countries:"),
    shiny::verbatimTextOutput("filtered_country")
  )
}

# Server -----
server <- function(input, output, session) {

    # Define reactive values
    rv <- shiny::reactiveValues(selected_countries = NULL, # Initialize reactive value for selected counties
                                last_click_id = NULL,
                                filtered_data = mapdata)


    shiny::observeEvent(input$mapfilter_shape_click, { # this is the logic behind the "click" of the map.

      click <- input$mapfilter_shape_click
      rv$last_click_id <- click$id
      ########## map behavior ################

      # If a country is clicked
      if (click$id %in% rv$selected_countries) {
        # If selected, remove it
        rv$selected_countries <- rv$selected_countries[rv$selected_countries != click$id]

      } else if(click$id == "selected"){ # when a county is clicked again it is removed

        rv$selected_countries <- rv$selected_countries[rv$selected_countries != tail(rv$selected_countries, n = 1)]

      }else {
        # If not selected, add it
        rv$selected_countries <- c(rv$selected_countries, click$id)
      }

      # Now update the leaflet
      leaflet::leafletProxy("mapfilter", session) |>
        leaflet::addPolygons(data = mapdata,
                             layerId = ~country,
                             label = ~country,
                             fillColor = ifelse(mapdata$country %in% rv$selected_countries, "#F47A60", "#7fe7dc"), # Change fill color based on selection
                             col = "#316879",
                             weight = 2,
                             fillOpacity = ifelse(mapdata$country %in% rv$selected_countries, 1, 0.5),
                             highlight = highlightOptions(
                               fillOpacity = 1,
                               bringToFront = TRUE)
        )

    })

    output$filtered_country <- shiny::renderPrint({
      paste(rv$selected_countries, collapse = ',')
    })

    # Leaflet
    output$mapfilter <- leaflet::renderLeaflet({ # rendering the filter map

      leaflet::leaflet() |>
        leaflet::addTiles() |> # The is the base map
        leaflet::addPolygons(data = mapdata,
                             color = '#316879',
                             weight = 1,
                             layerId = ~country,
                             label = ~country,
                             fillColor = "#7fe7dc",
                             fillOpacity = .5,
                             highlight = highlightOptions(
                               fillOpacity = 1,
                               bringToFront = TRUE
                             )) |>
        leaflet::setView(zoom = 1, lng = 0, lat =50)

    })

    # Reset the map filter
    shiny::observeEvent(input$resetmap, {

      rv$selected_countries <- NULL
      rv$last_click_id <- NULL
      rv$filtered_data <- mapdata

      leafletProxy("mapfilter", session) |>
        leaflet::addPolygons(data = mapdata,
                             color = '#316879',
                             weight = 1,
                             layerId = ~country,
                             label = ~country,
                             fillColor = "#7fe7dc",
                             fillOpacity = .5,
                             highlight = highlightOptions(
                               fillOpacity = 1,
                               bringToFront = TRUE
                             )) |>
        leaflet::setView(zoom = 1, lng = 0, lat =50)

    })


    # Return reactive values
    return(
      list(
        value = shiny::reactive(rv$selected_countries),
        filtered  = shiny::reactive(rv$filtered_data)
      )
    )

}


# Run the app -----
shinyApp(ui = ui, server = server)
Hosting and deployment
- Shinyapps.io
- Shiny Server (on-premises or cloud)
- Posit Connect
- Docker container
- shinylive
Resources
- Shiny official website: https://shiny.posit.co/
- Shiny cheat sheet: https://shiny.posit.co/r/articles/start/cheatsheet/
- Book - Mastering Shiny by Hadley Wickham: https://mastering-shiny.org/
- Shiny official GitHub: https://github.com/rstudio/shiny
- Stack Overflow: https://stackoverflow.com/questions/tagged/shiny
- Book - Engineering Production-Grade Shiny Apps: https://engineering-shiny.org/
- Awesome R Shiny: https://github.com/grabear/awesome-rshiny
- Awesome Shiny Extensions: https://github.com/nanxstats/awesome-shiny-extensions